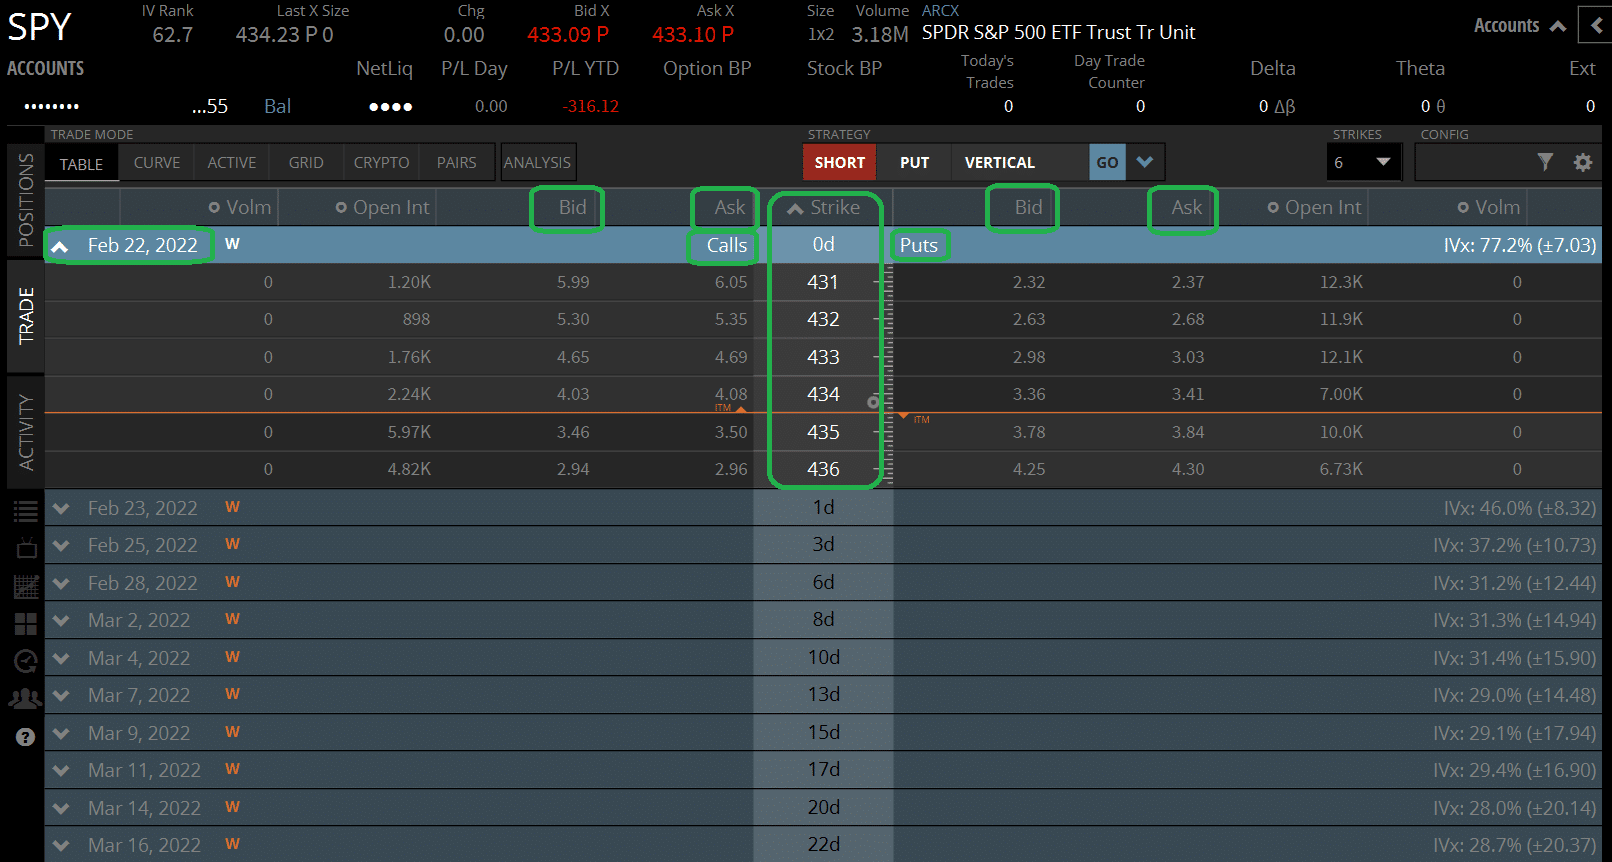
How to Read an Option Chain

An Option Chain table offers information consisting of bid and ask prices for options contracts, the last traded price (LTP), open interest, volume, and other essential relevant details. The view is presented as a table, with information being organized into columns for each strike price and put or call option.
Understanding the Various Columns in Nifty Trader Option Chain
The Nifty Trader Option Chain has several columns with unique data that successful traders use for analysis and trader sentiment. Here is a list of the column headers:
- Strike Price: Refers to the price at which buyers have the right to sell or buy shares.
- Last Price (LTP): The most recent price at which a trade occurred for that option.
- Premium: The cost that the buyer/seller agrees to pay/receive for the options contract.
- Open Interest: The total number of open contracts that exist for a particular option. This number doesn’t change often and reflects both new and expired contracts.
- Change in Open Interest (OI): The net change in open interest compared to the previous day.
- Volume: The number of contracts traded on that particular day.
- Implied Volatility (IV): A measure of the market’s expectation of the stock’s volatility in the future.
- Greeks: This column includes Option Greeks, Delta, Gamma, Vega, and Theta. These provide critical information about the price movement and potential impact of changes in the underlying asset, option price, time to expiry, interest rate, and implied volatility.
Analyzing Option Chain Data
Open Interest (OI) refers to the number of contracts that are yet to be closed out by an offsetting trade. It is essential to keep a close eye on the OI for a particular option as this number will provide insight into how many people are interested in the option and whether the interest is increasing or decreasing. Suppose the open interest on a strike price is increasing, it typically implies that traders are confident that the price will move in the direction of their trade.
Similarly, trading volume is the number of contracts traded throughout a day. By analyzing volume, traders get an idea of whether it can help confirm a price trend or potential reversal. A high volume signifies increased participation and confidence while a low volume indicates less involvement and less confidence in its trading direction.
How to Use Option Chain Data to Make Trading Decisions
While analyzing the information provided in the NSE Option Chain, traders can analyze the market sentiment to help them make better trading decisions. Here are some tips for using the data in the Options Chain to make trading decisions:
- Identify the trend: A trend in the Options Chain indicates an increase or decrease in confidence among other traders.
- Look for unusual activity: When there is unusual activity on an option, it may indicate insider trading or institutional trades that can impact the market as a whole.
- Use Greeks to inform trading strategies: Using Greeks can help Nifty traders identify potential risks and profit opportunities.
- Set alerts: With the help of advanced trading tools, traders can set alerts to identify options that meet specific criteria.
Conclusion
In conclusion, reading and understanding the option chain is an important aspect of options trading. With the valuable information that Option Chains provide, traders can make more informed investment decisions. This guide has provided an overview of how to read an option chain, how to analyze the data, and how to make use of the data when developing your trading strategies. To hone your skills, take time to practice, stay disciplined, and use advanced tools and professional guidance to advance in the world of options trading.


